Owlpane / Solutions / vs. New Relic
Moving from another tool · built on OpenTelemetryOwlpane vs. New Relic: both price by data, only one adds per-user fees.
New Relic bills data ingest plus paid full-platform users. Owlpane bills GB ingested only, with no per-seat fee. New Relic is far broader; here is where that matters and where it does not.
- Keep
Your OpenTelemetry instrumentation. Send a copy to Owlpane and keep New Relic while you compare.
- Gain
No per-user fee, so engineers, support and managers can all look at the data. Carbon per service and a Kubernetes explorer with actions on the same telemetry.
- Give up
Breadth and maturity. New Relic has many more integrations, browser and mobile depth, and enterprise features we do not offer.
Switching, honestly
Why teams try Owlpane beside it
Keep what works
Your OpenTelemetry instrumentation. Send a copy to Owlpane and keep New Relic while you compare.
What you gain
No per-user fee, so engineers, support and managers can all look at the data. Carbon per service and a Kubernetes explorer with actions on the same telemetry.
What you give up
Breadth and maturity. New Relic has many more integrations, browser and mobile depth, and enterprise features we do not offer.
Priced by data
One meter: GB ingested, with a spend cap that samples instead of surprising you. No per-seat or per-host fee.
Standard OTLP in and out
Nothing proprietary to migrate away from later. Everything Owlpane receives can be read by any OpenTelemetry backend.
Signals that link
A log line opens the request that wrote it, and errors carry a sample trace, so you follow one story instead of several tabs.
What you use
Built from features that ship today

Alert rules
Checked every minute; one message when it fires and one when it resolves.
Alerting & SLOs →
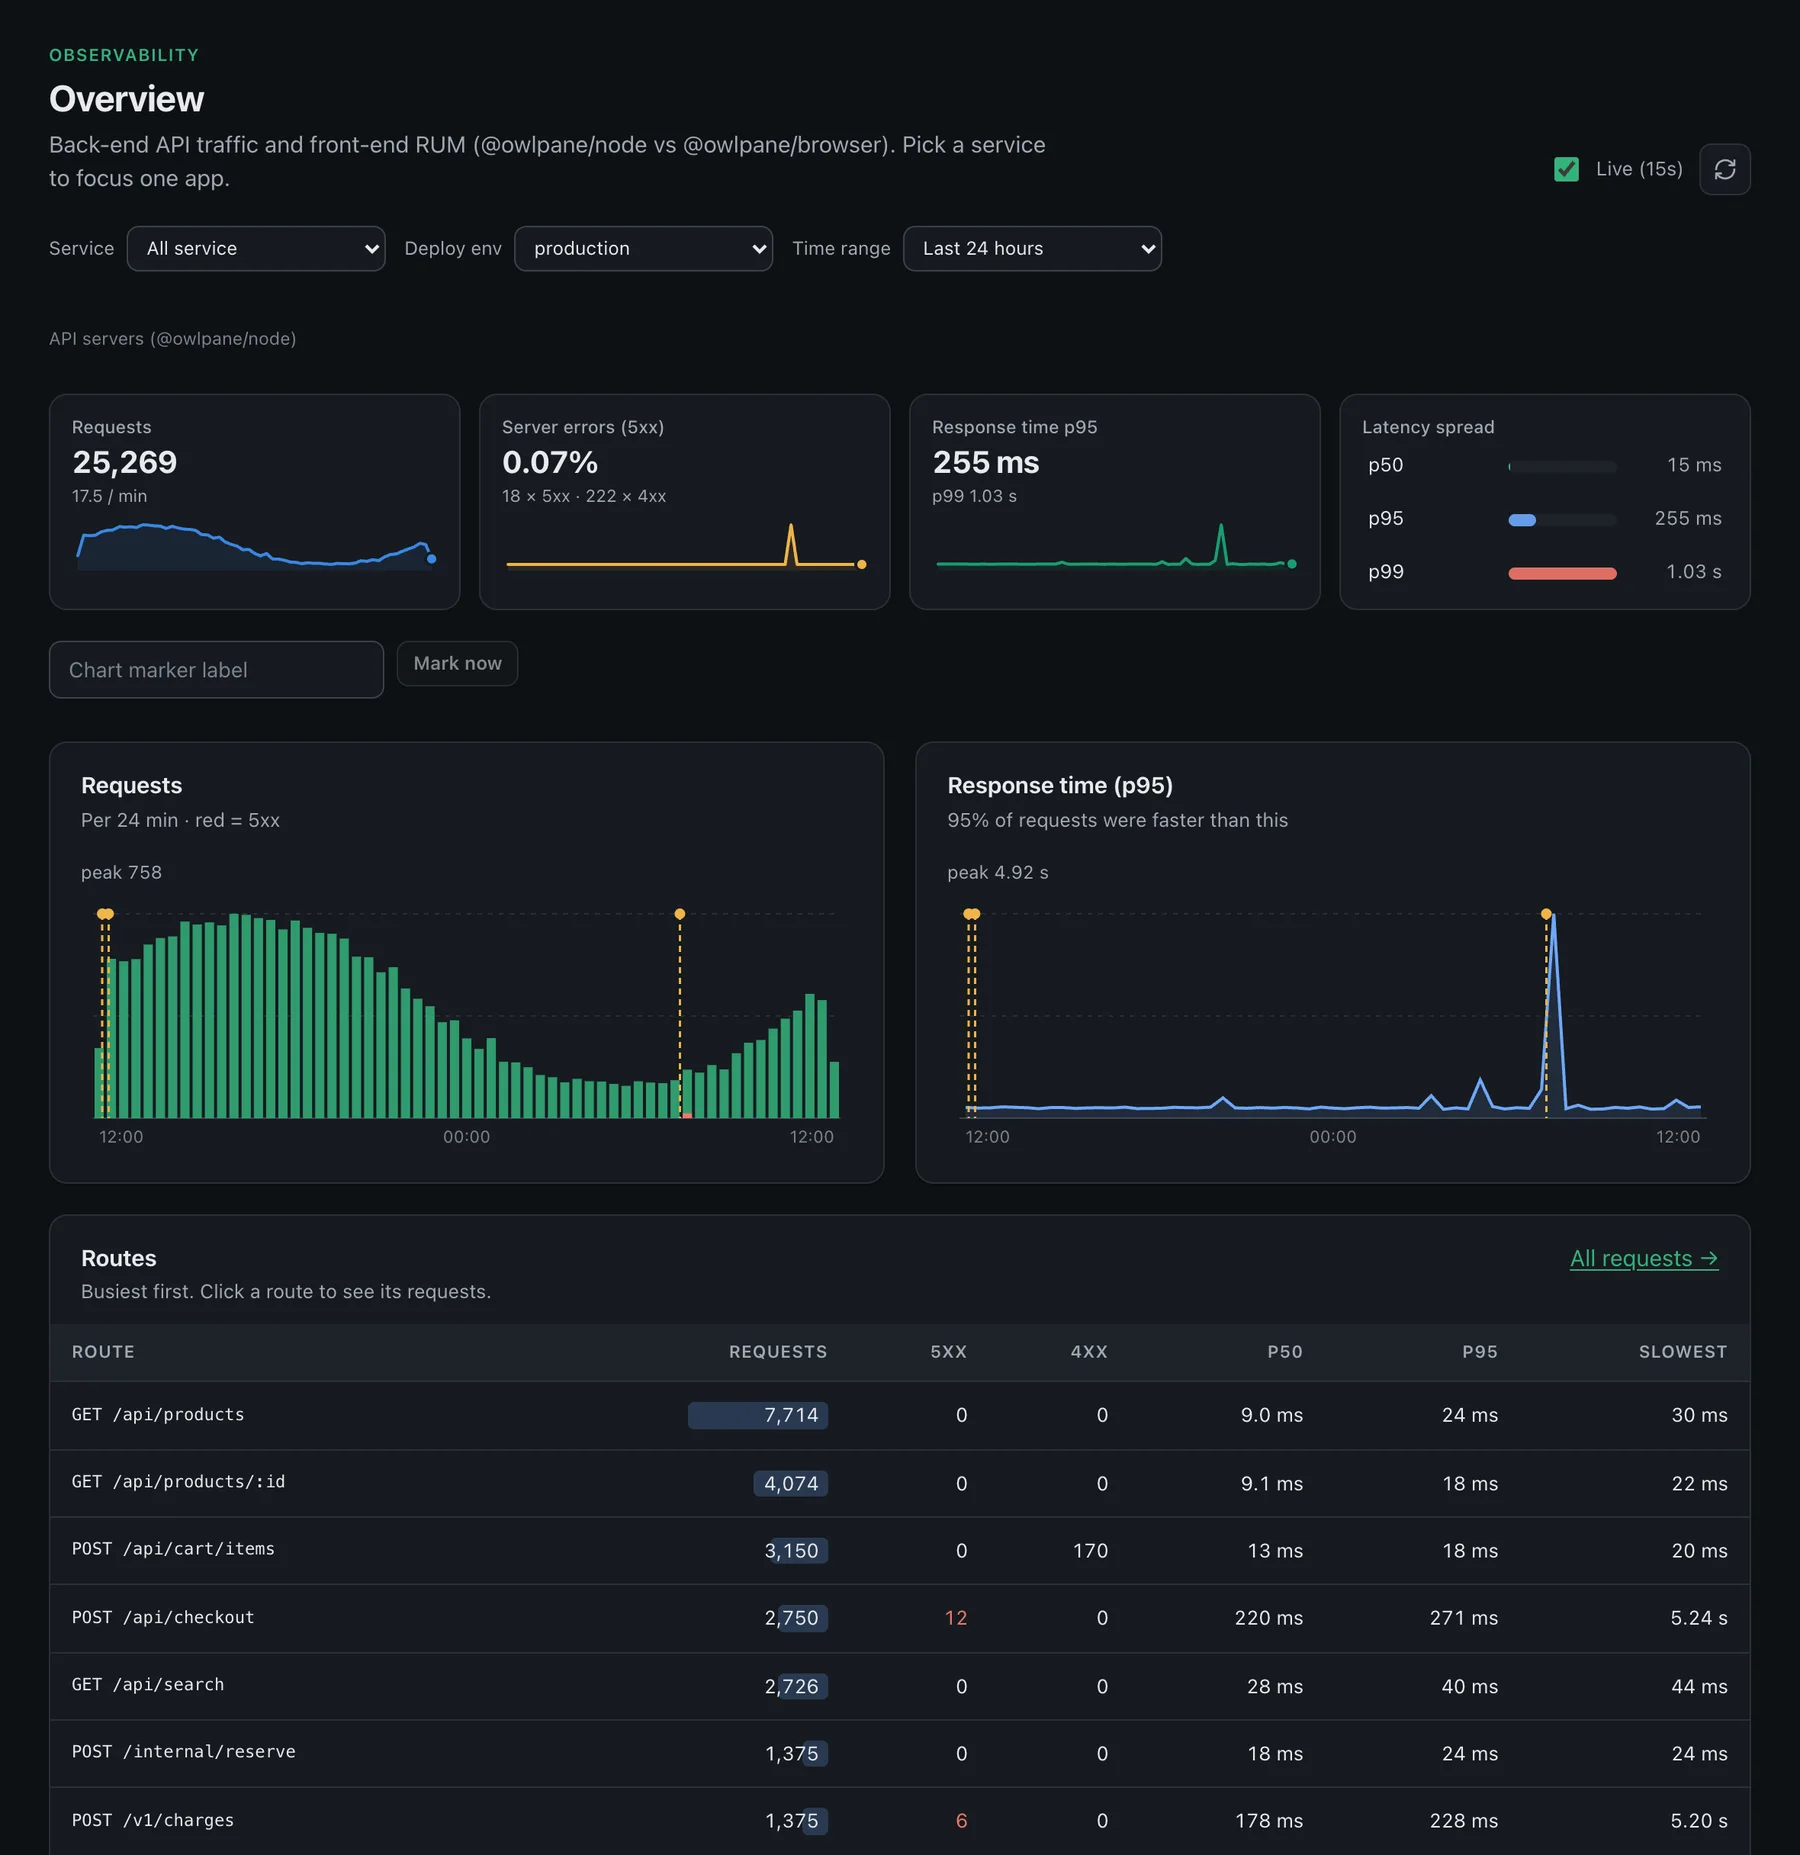
How it works
Three steps
Add an exporter
Add one exporter to your OpenTelemetry Collector and your current tool keeps receiving everything it does today.
Compare
Run both on the same service for a week.
Decide
Nothing proprietary to undo either way.
Side by side
What each one charges for
| New Relic (public list, 2026) | Owlpane | |
|---|---|---|
| Free tier | 100 GB ingest a month, one free full-platform user | 10 GB a month; ingest pauses above 10 GB until you upgrade |
| Data | $0.40 per GB beyond 100 GB (Standard and Pro), $0.60 with Data Plus | Lake Starter is $29/mo including 100 GB, then $0.35/GB ($0.25 past 1 TB). Realtime is $49/mo on Starter ($29 base + $20 access, 100 GB included, then $0.22/GB). Lake+Realtime is both bills, $78/mo on Starter. Business is the same 100 GB plus $59/mo for SSO, SCIM and audit ($88 Lake, $108 Realtime, $137 Lake+Realtime). No per-seat or per-host fee. |
| People | Full-platform users are priced per user, by edition; basic users are view-only | No per-seat fee |
| What you forecast | GB ingested plus the number of full users | GB ingested |
New Relic figures come from public pricing summaries in September 2026; confirm on newrelic.com/pricing. Its free tier is larger than ours, so compare on your own volume and team size. New Relic pricing · Estimate Owlpane with the cost calculator
Feature coverage
Owlpane against New Relic's products
| New Relic product | Owlpane | Coverage | Reference |
|---|---|---|---|
| APM & distributed tracing | Application performance | Built | APM & tracing → |
| Kubernetes monitoring | Kubernetes monitoring | Partial | Kubernetes → |
| Network monitoring | Infrastructure monitoring | Partial | Infrastructure → |
Coverage is Owlpane's own assessment of New Relic's public product list. Partial means a narrower feature set; bring your own means you run the exporter.
Questions
Does Owlpane charge per user?
Where Owlpane is narrower
- Fewer integrations, and thinner browser and mobile monitoring.
- No per-user pricing model to mirror, but also no enterprise procurement track record yet.
Comparisons reflect publicly available information as of September 2026 and our own product today, and may change. Datadog, New Relic, Grafana, Grafana Cloud, Loki, Tempo, Dash0, Better Stack, Bronto, Logz.io, Amazon CloudWatch, AWS, Sentry, Dynatrace, Kubeshark, Checkly, PagerDuty, SigNoz, Kubernetes, OpenTelemetry, Prometheus and other names are trademarks of their respective owners; Owlpane is not affiliated with or endorsed by them.

Send a copy of your telemetry. Change nothing else.
Standard OpenTelemetry in, so you can try Owlpane beside what you run today.
Free: 10 GB of ingest a month, 7-day query window, unlimited projects. No card to start. Documentation · Pricing · Pricing questions