Search spans and log lines by any field — and land on the request behind them.
Logs share the same attributes as traces, so a customer id, a route or an order number finds everything that touched it. Lines written during a request link straight to that request.
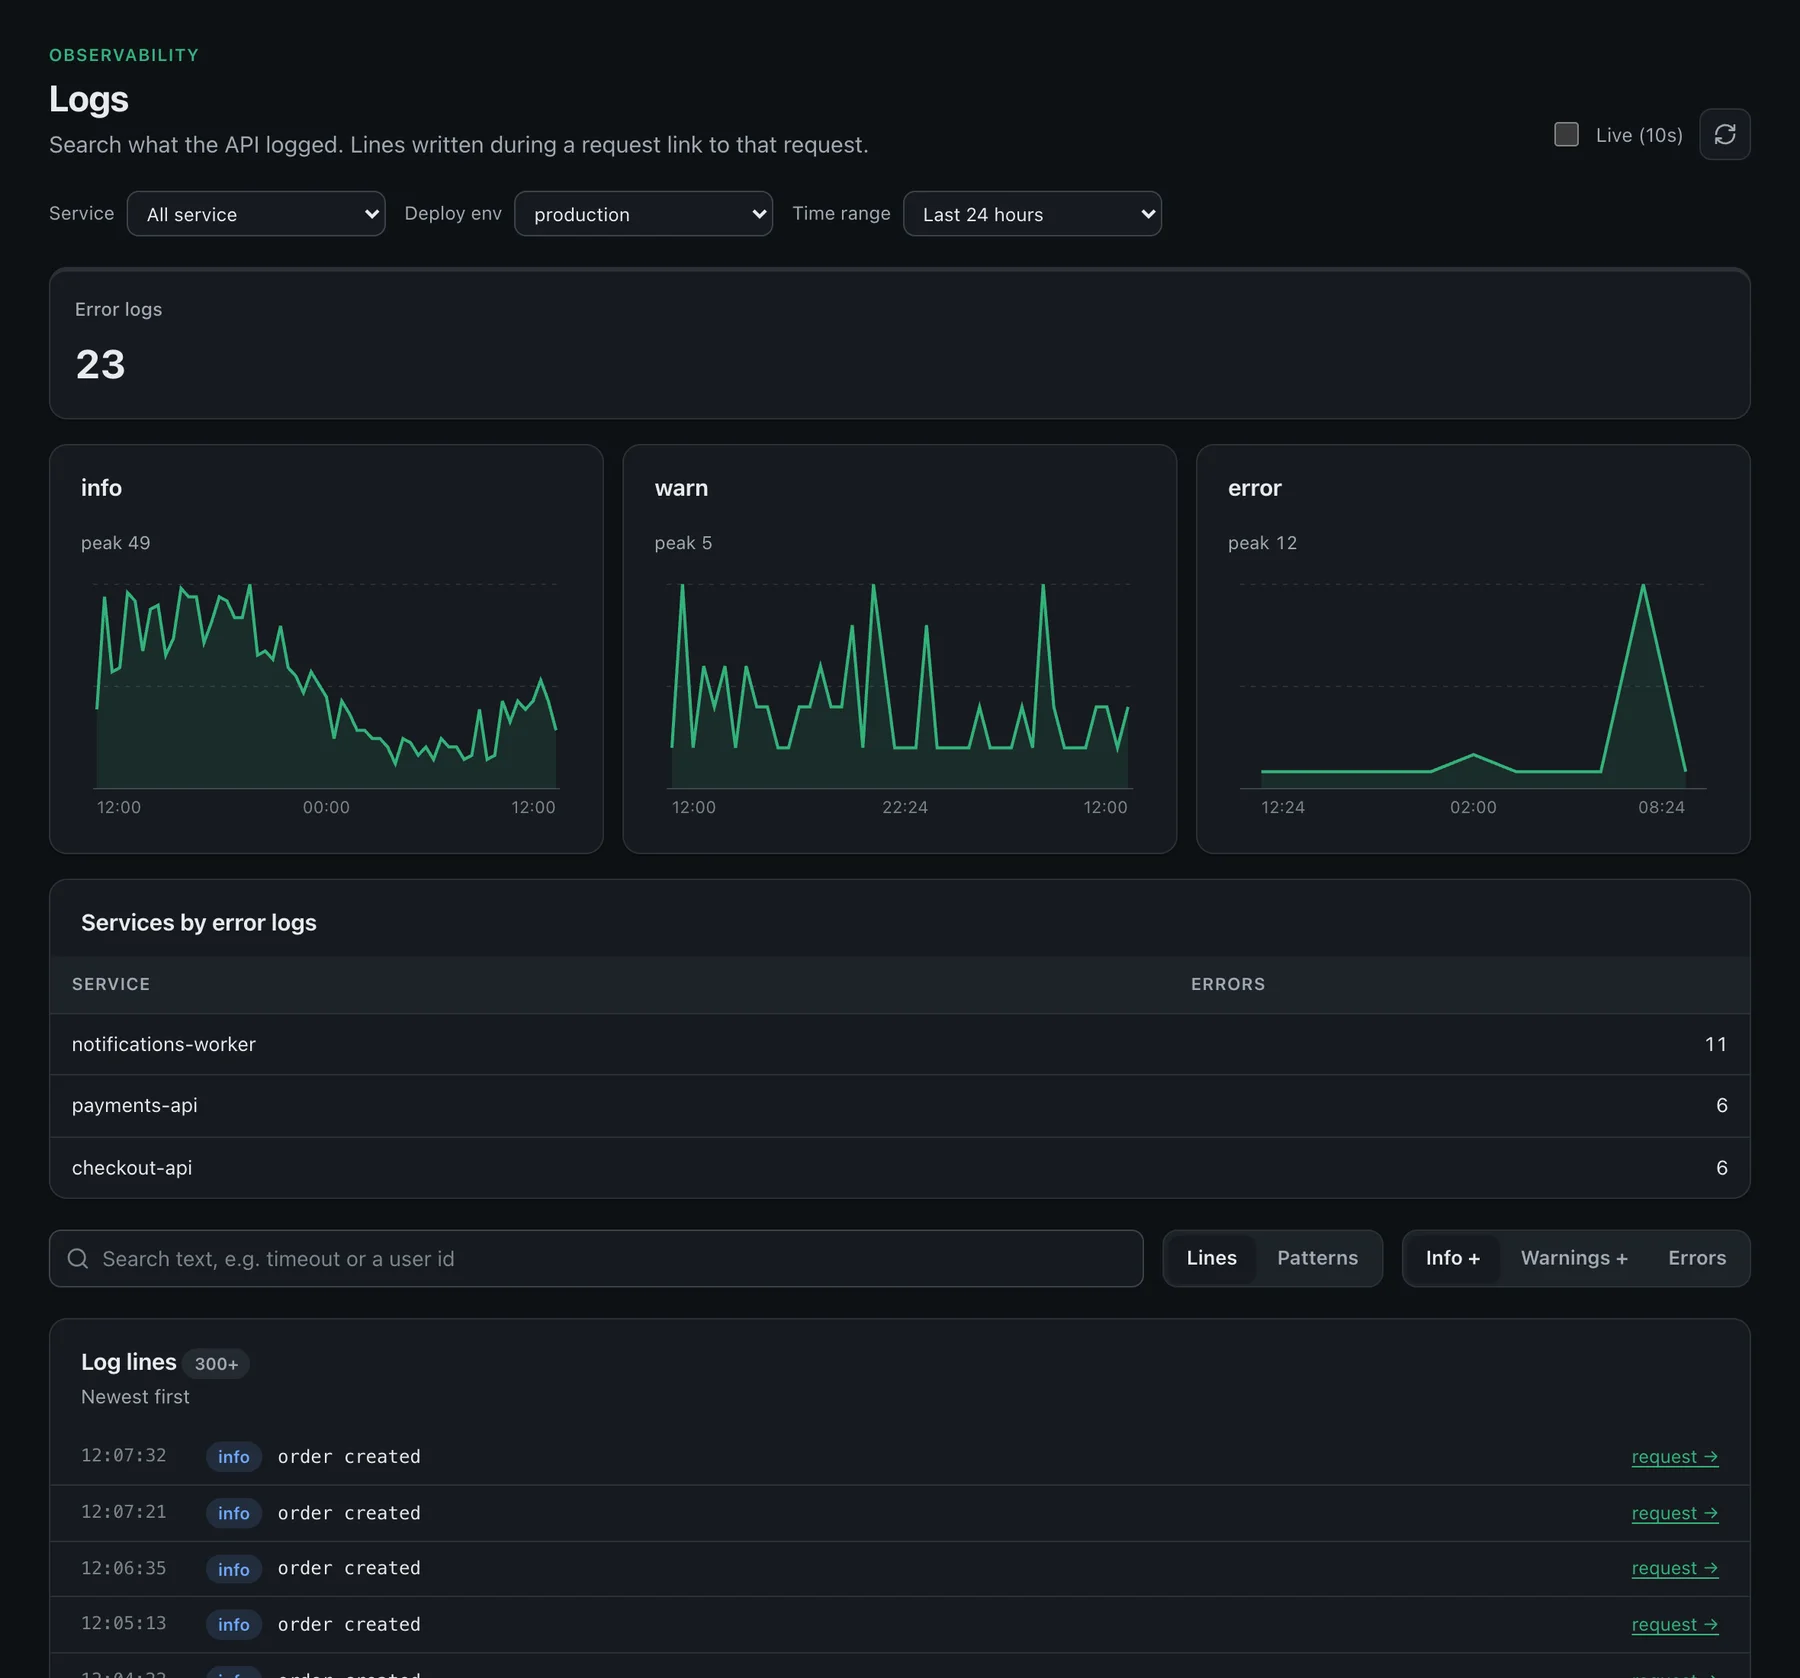
Find the line, then the request that wrote it
Search log lines, see volume by level, and open the trace behind any line. Logs, traces and metrics stay linked.
Illustration with example values, not live data.
What you get
Logs & search, in detail
Logs
Search what your services logged. Lines written during a request link to that request.
Search everything
Find spans or log lines by any field or attribute — a customer id, a route, a status. Click any value in a result to filter by it. Volume bars show when.

Correlated activity
Spans and logs in one newest-first timeline for a cluster, namespace or workload, each row expanding to the full record and request waterfall.
Redacted when shown
Tokens, secrets, e-mail addresses and card-like numbers are redacted when telemetry is shown or exported. This site does not claim they are removed before storage.
Ingest pipeline
Standard OTLP in. Logs, traces and metrics use the same ingest key and the same per-tenant isolation.
How it works
From zero to data in three steps
Export
Send logs over OTLP from the OpenTelemetry SDK or a Collector — or use the Kubernetes agent.
Correlate
trace_id and span_id tie each line to its request; resource attributes tie it to a pod or service.
Retain
The query window follows your plan: 7 days on Free; 30 days for traces and logs and 90 days for metrics on Starter and Business. That is not physical deletion unless the lake retention sweep is turned on.
exporters:
  otlphttp/owlpane:
    endpoint: https://ingest.example.com
    headers:
      Authorization: "Bearer ${env:OWLPANE_INGEST_KEY}"

service:
  pipelines:
    logs:
      exporters: [otlphttp/owlpane]
How it compares
Honest about where we are today
Comparable to
Where Owlpane is narrower
- Log analytics is search-first; there is no separate query language or log-to-metric rule engine yet.
- Prometheus-compatible reads are supported for metrics, not a full LogQL clone.
Comparisons reflect publicly available information as of September 2026 and our own product today, and may change. Datadog, New Relic, Grafana, Grafana Cloud, Loki, Tempo, Dash0, Better Stack, Bronto, Logz.io, Amazon CloudWatch, AWS, Sentry, Dynatrace, Kubeshark, Checkly, PagerDuty, SigNoz, Kubernetes, OpenTelemetry, Prometheus and other names are trademarks of their respective owners; Owlpane is not affiliated with or endorsed by them.
More from Owlpane
Everything shares one pane
Try Logs beside what you run today.
Standard OpenTelemetry in, so you can send a copy and compare. Nothing proprietary to migrate away from later.
Free: 10 GB of ingest a month, 7-day query window, unlimited projects. No card to start. Documentation · Pricing · Pricing questions