Owlpane / Solutions / Datadog alternative
Moving from another tool · built on OpenTelemetryA Datadog alternative for small teams: one bill, priced by data.
Datadog bills per host, per ingested log GB, per indexed million events and per module. Owlpane bills by data ingested only, so you can forecast it before you sign up. Send a copy of your OpenTelemetry data and compare during a real incident.
- Keep
Your OpenTelemetry instrumentation and your Datadog account while you compare. Nothing proprietary to undo later.
- Gain
A bill that depends on one number, GB ingested, with a spend cap that samples instead of surprising you. Traces, logs, metrics and Kubernetes share one ingest key.
- Give up
Breadth. Datadog has a far larger integration catalogue plus network and security products we do not offer, and services on the proprietary tracer need OpenTelemetry first.
Switching, honestly
Why teams try Owlpane beside it
Keep what works
Your OpenTelemetry instrumentation and your Datadog account while you compare. Nothing proprietary to undo later.
What you gain
A bill that depends on one number, GB ingested, with a spend cap that samples instead of surprising you. Traces, logs, metrics and Kubernetes share one ingest key.
What you give up
Breadth. Datadog has a far larger integration catalogue plus network and security products we do not offer, and services on the proprietary tracer need OpenTelemetry first.
Priced by data
One meter: GB ingested, with a spend cap that samples instead of surprising you. No per-seat or per-host fee.
Standard OTLP in and out
Nothing proprietary to migrate away from later. Everything Owlpane receives can be read by any OpenTelemetry backend.
Signals that link
A log line opens the request that wrote it, and errors carry a sample trace, so you follow one story instead of several tabs.
What you use
Built from features that ship today


Cluster explorer
Nodes, workloads and pods with a jump to their traces, from one Helm install.
Kubernetes →
Alert rules
Checked every minute; one message when it fires and one when it resolves.
Alerting & SLOs →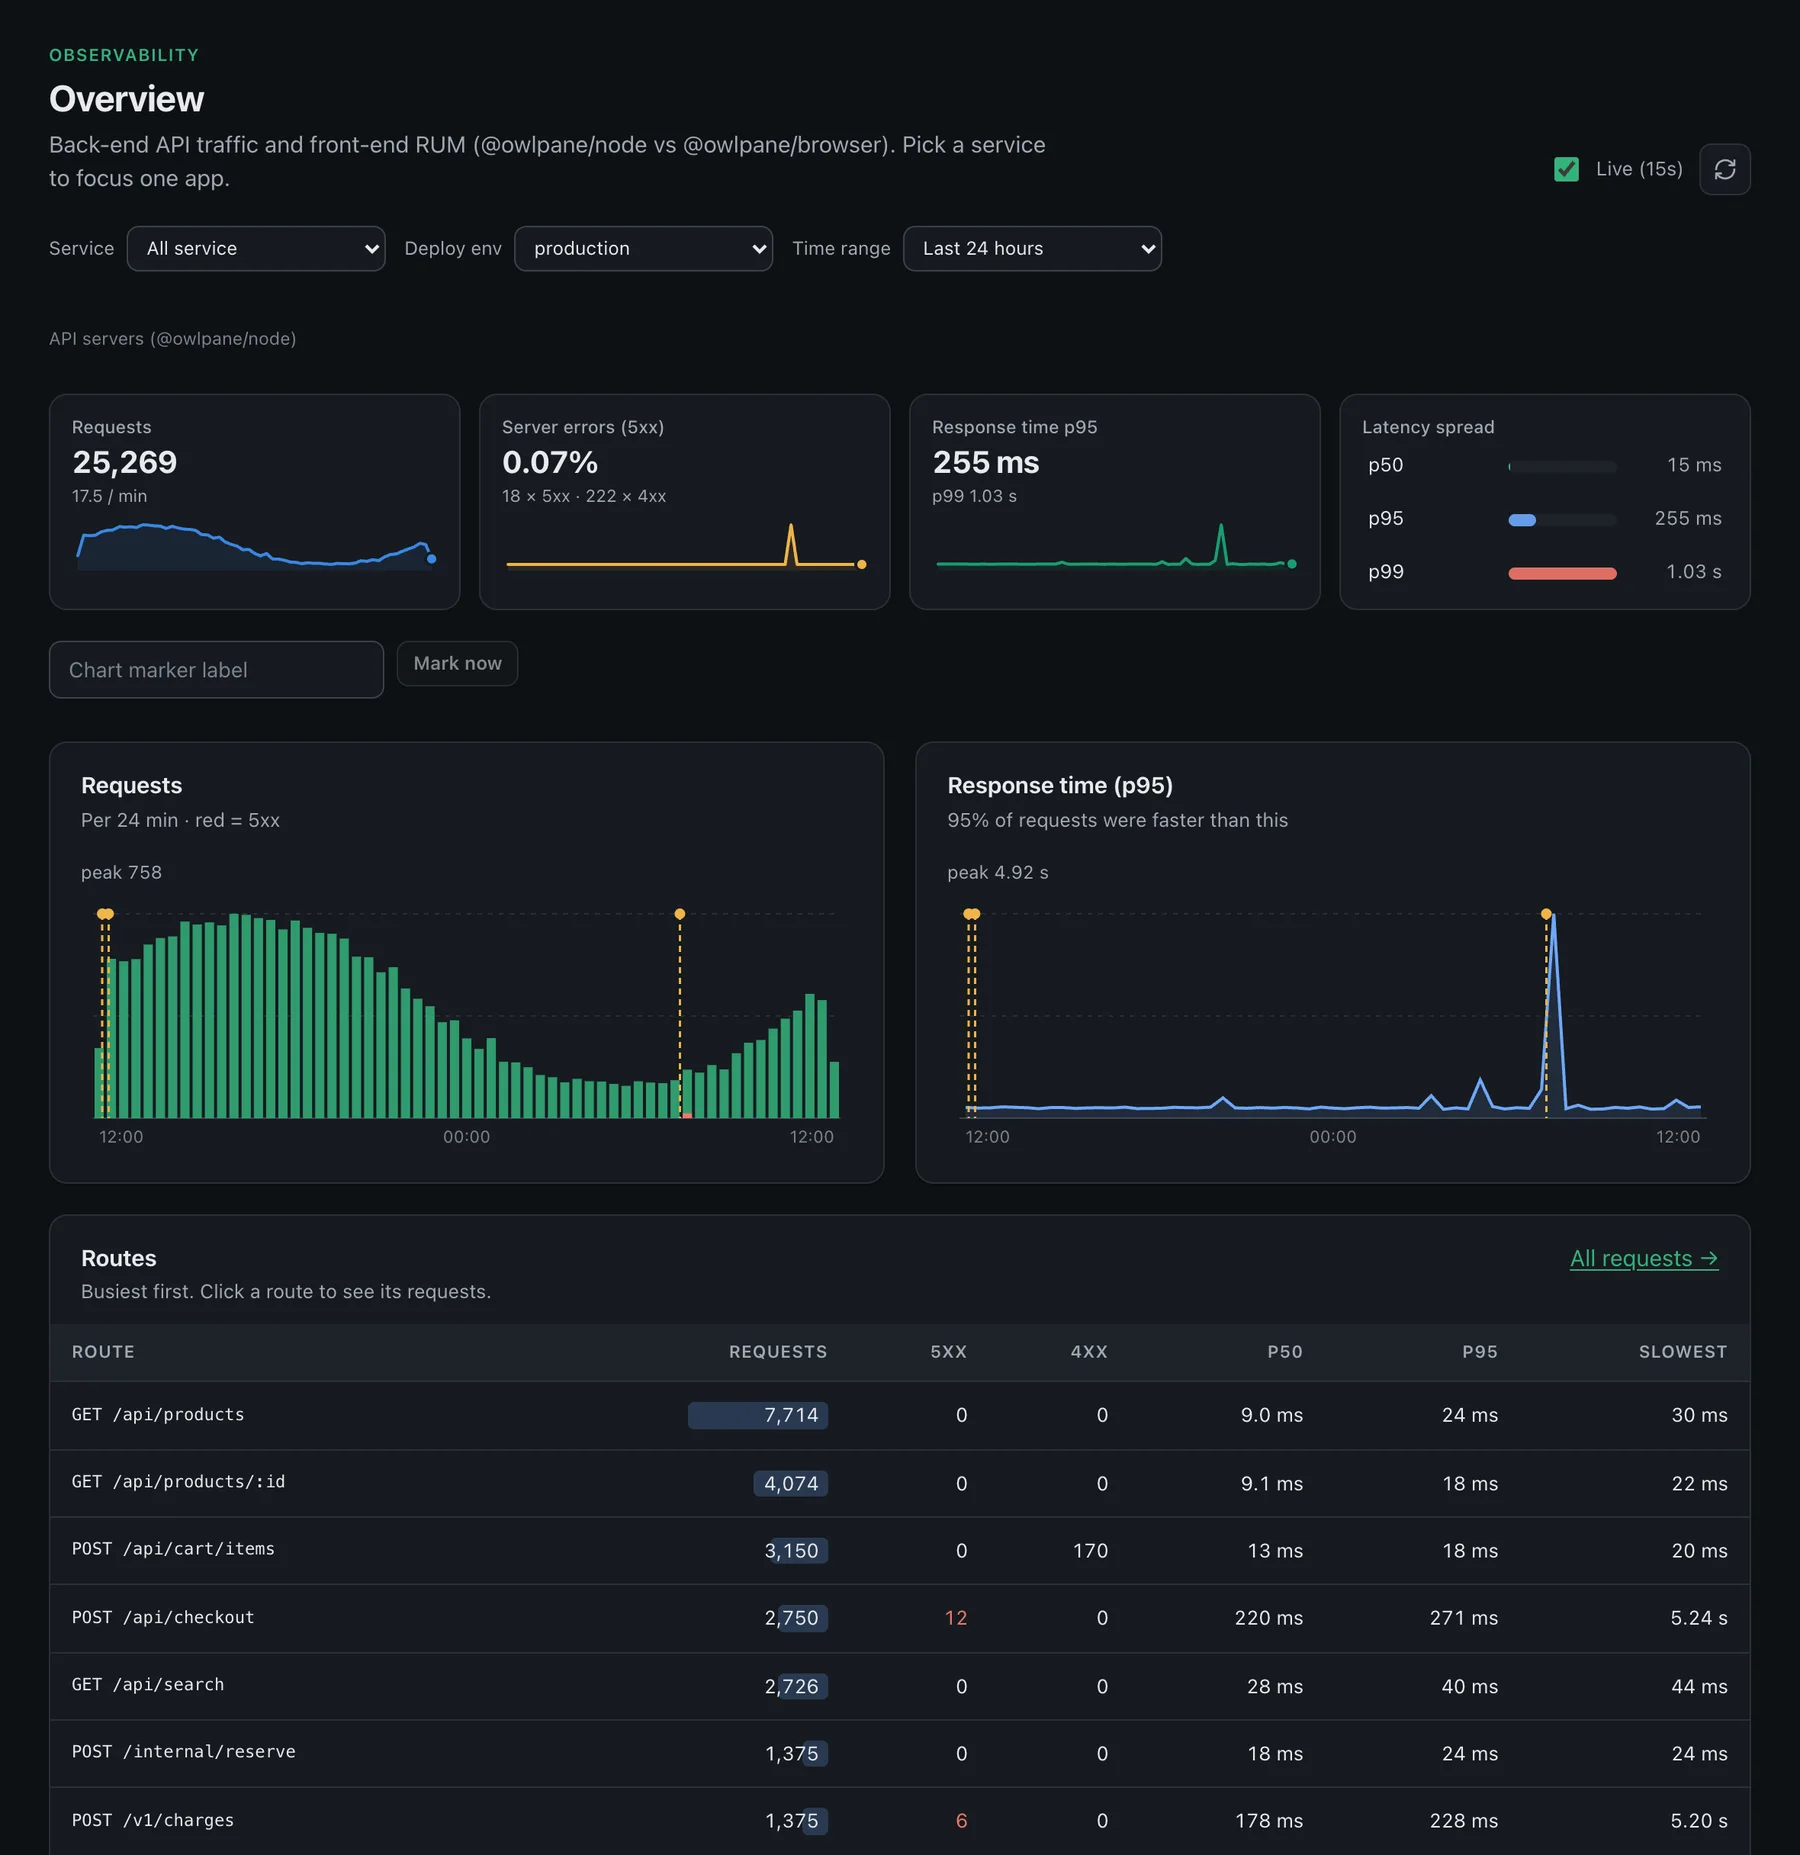
How it works
Three steps
Add an exporter
Add one exporter to your OpenTelemetry Collector and your current tool keeps receiving everything it does today.
Compare on a real incident
Start with one service or ten percent of traffic.
Move what works
Keep Datadog for anything we do not cover.
Side by side
What each one charges for
| Datadog (list price) | Owlpane | |
|---|---|---|
| Infrastructure | $15 per host per month, billed annually ($18 on demand) | Not billed per host |
| APM | $31 per host per month with Infrastructure, billed annually ($48 on demand) | Not billed per host |
| Logs | $0.10 per ingested GB, plus $1.70 per million indexed events per month for 15-day retention (annual) | Counted in GB ingested, like every other signal |
| What you forecast | Hosts, GB, indexed events and each extra module | One number: GB ingested per month |
| Entry point | Paid, per product | Free up to 10 GB a month. Lake Starter is $29/mo including 100 GB, then $0.35/GB ($0.25 past 1 TB). Realtime is $49/mo on Starter ($29 base + $20 access, 100 GB included, then $0.22/GB). Lake+Realtime is both bills, $78/mo on Starter. Business is the same 100 GB plus $59/mo for SSO, SCIM and audit ($88 Lake, $108 Realtime, $137 Lake+Realtime). No per-seat or per-host fee. |
Datadog figures are public list prices we read on datadoghq.com/pricing in September 2026. Custom metrics, RUM, security and other products are extra, so treat any Datadog estimate as a floor. Discounts and commitments change the real number. Datadog pricing · Estimate both with the cost calculator
Feature coverage
Owlpane against Datadog's products
| Datadog product | Owlpane | Coverage | Reference |
|---|---|---|---|
| APM / RUM / Logs | Application performance | Partial | APM & tracing → |
| Infrastructure Monitoring | Kubernetes monitoring | Partial | Kubernetes → |
| Cloud Network Monitoring (CNM) | Kubernetes monitoring | Partial | Kubernetes → |
| Infrastructure Monitoring | Infrastructure monitoring | Partial | Infrastructure → |
| Network Device Monitoring (NDM) | Infrastructure monitoring | Partial | Infrastructure → |
| APM / RUM / Logs | Logs & search | Partial | Logs → |
| APM / RUM / Logs | Real user monitoring & uptime | Partial | RUM & uptime → |
| MCP / Bits AI | AI & assistants | Partial | AI & MCP → |
Coverage is Owlpane's own assessment of Datadog's public product list. Partial means a narrower feature set; bring your own means you run the exporter.
Questions
Is Owlpane really cheaper than Datadog?
Can I keep my Datadog agent?
Where Owlpane is narrower
- No ~900-integration catalogue, network monitoring suite or security products.
- Smaller ecosystem of community content than Datadog.
Comparisons reflect publicly available information as of September 2026 and our own product today, and may change. Datadog, New Relic, Grafana, Grafana Cloud, Loki, Tempo, Dash0, Better Stack, Bronto, Logz.io, Amazon CloudWatch, AWS, Sentry, Dynatrace, Kubeshark, Checkly, PagerDuty, SigNoz, Kubernetes, OpenTelemetry, Prometheus and other names are trademarks of their respective owners; Owlpane is not affiliated with or endorsed by them.

Send a copy of your telemetry. Change nothing else.
Standard OpenTelemetry in, so you can try Owlpane beside what you run today.
Free: 10 GB of ingest a month, 7-day query window, unlimited projects. No card to start. Documentation · Pricing · Pricing questions